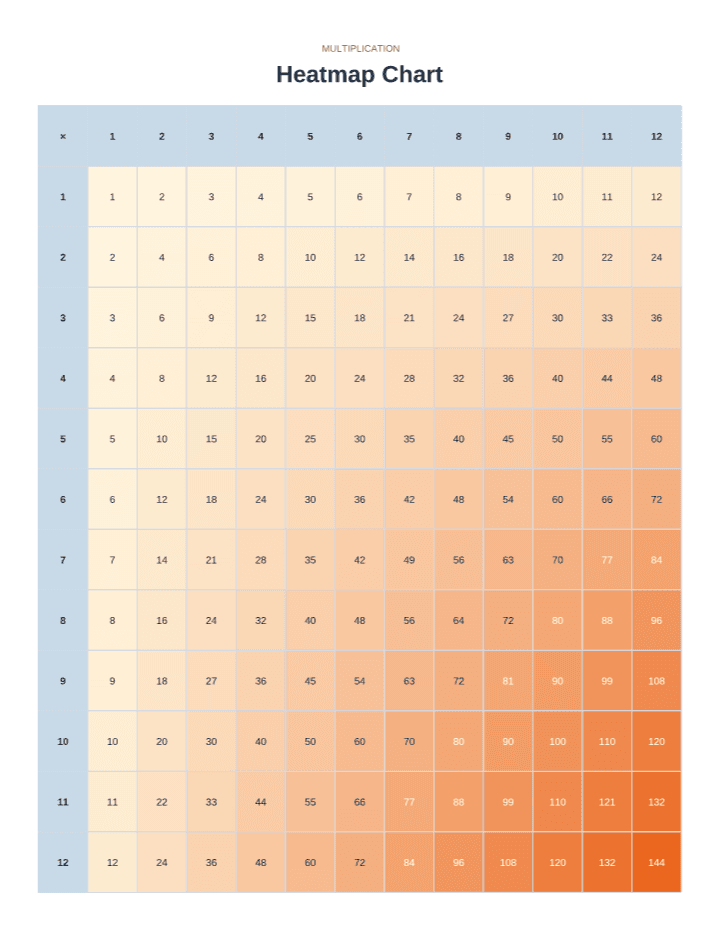
Multiplication Heatmap Chart 1–12
LETTER · A4 · Portrait · Free PDF
Free · No sign-up · Instant download
Free printable multiplication heatmap chart PDF. A unique 12×12 times table where each product cell is shaded from light cream to deep orange — the larger the answer, the darker the color. Students can instantly see which facts produce big vs. small products and get a feel for how the table grows. Grade 3–5. Letter and A4.
About This Multiplication Heatmap Chart 1–12
Free printable multiplication heatmap chart PDF. A unique 12×12 times table where each product cell is shaded from light cream to deep orange — the larger the answer, the darker the color. Students can instantly see which facts produce big vs. small products and get a feel for how the table grows. Grade 3–5. Letter and A4. This printable is available in US Letter (8.5 × 11 inch) and A4 (210 × 297 mm). All files print correctly at 100% scale on any home or office printer.
Specifications
- Table range
- 1 × 1 to 12 × 12
- Total cells
- 169 cells (12×12 + headers)
- Chart type
- Filled (completed)
- Recommended grade
- Grade 3–5
- Available sizes
- US Letter, A4
How It Compares
The 1-12 chart is the most widely used multiplication reference in US and UK curricula. The 12 times table is particularly useful because of its relevance to inches in a foot, months in a year, and dozens. For students who need more practice, pair this filled chart with the blank 1-12 chart for self-testing.
Printing Tip
For a durable classroom reference, print on cardstock and laminate. For practice, print weekly and use a timer — regular timed sessions help students notice their own progress.
Usage Rights
PrintableCove's multiplication heatmap chart 1–12 is free to download and print for personal, classroom, and homeschool use. No account required, no watermarks, no expiry date. You may print unlimited copies for your students or children. Please do not redistribute or resell the PDF files — if you want to share this resource, link to this page instead.